
A Weather-Based Explanation Using Real Data from January 2025 vs. January 2026 in Rochester New York
If your heating bill was higher than expected this January, you’re not imagining it, and you’re certainly not alone. Across Western New York, homeowners using geothermal heat pumps, electric heat, natural gas, propane, and fuel oil are all seeing higher heating costs this winter.
As geothermal heat pump installers, one of the first tools we use to understand rising energy bills is weather data, not guesswork. When we compare January 2025 to January 2026, the explanation becomes very clear:
This winter has been unusually cold, and that directly drives heating costs up.
Comparing the Weather: January 2025 vs. January 2026
The chart below compares daily average outdoor temperatures for both months in Rochester New York.
Average Daily Temperatures (°F)
| Month | Typical Daily Averages |
| January 2025 | Mostly mid-20s to mid-30s |
| January 2026 | Many days near or below 10°F, with fewer moderate days |
In January 2026:
- Cold wasn’t limited to a few extreme days
- Many days stayed cold around the clock
- Overnight recovery was minimal
This matters because buildings lose heat continuously. When cold persists day after day, heating systems must deliver far more total energy just to maintain the same indoor comfort.
Actual Day by Day weather comparison (Source: WeatherUnderground)
Click Here to Reveal Actual Day by Day Weather Data for January 2025 to January 2026
| January 2025 | January 2026 | ||||
|---|---|---|---|---|---|
| Day | Avg Temp (°F) | HDD (Base 65) | Day | Avg Temp (°F) | HDD (Base 65) |
| 1 | 37.4 | 27.6 | 1 | 14.7 | 50.3 |
| 2 | 32.6 | 32.4 | 2 | 18.4 | 46.6 |
| 3 | 28.4 | 36.6 | 3 | 22.8 | 42.2 |
| 4 | 24.3 | 40.7 | 4 | 24.4 | 40.6 |
| 5 | 25.1 | 39.9 | 5 | 27.8 | 37.2 |
| 6 | 19.8 | 45.2 | 6 | 34.8 | 30.2 |
| 7 | 20.9 | 44.1 | 7 | 35.6 | 29.4 |
| 8 | 18.0 | 47.0 | 8 | 40.2 | 24.8 |
| 9 | 19.0 | 46.0 | 9 | 48.1 | 16.9 |
| 10 | 21.3 | 43.7 | 10 | 39.1 | 25.9 |
| 11 | 26.7 | 38.3 | 11 | 30.9 | 34.1 |
| 12 | 31.6 | 33.4 | 12 | 32.1 | 32.9 |
| 13 | 30.0 | 35.0 | 13 | 39.5 | 25.5 |
| 14 | 19.6 | 45.4 | 14 | 40.6 | 24.4 |
| 15 | 20.8 | 44.2 | 15 | 17.8 | 47.2 |
| 16 | 22.6 | 42.4 | 16 | 22.3 | 42.7 |
| 17 | 32.6 | 32.4 | 17 | 32.5 | 32.5 |
| 18 | 35.6 | 29.4 | 18 | 22.0 | 43.0 |
| 19 | 20.7 | 44.3 | 19 | 18.7 | 46.3 |
| 20 | 14.0 | 51.0 | 20 | 11.6 | 53.4 |
| 21 | 9.2 | 55.8 | 21 | 24.8 | 40.2 |
| 22 | 8.7 | 56.3 | 22 | 25.7 | 39.3 |
| 23 | 21.5 | 43.5 | 23 | 10.7 | 54.3 |
| 24 | 21.1 | 43.9 | 24 | 4.7 | 60.3 |
| 25 | 22.4 | 42.6 | 25 | 8.4 | 56.6 |
| 26 | 30.5 | 34.5 | 26 | 12.6 | 52.4 |
| 27 | 30.5 | 34.5 | 27 | 11.9 | 53.1 |
| 28 | 25.2 | 39.8 | 28 | 11.9 | 53.1 |
| 29 | 29.6 | 35.4 | 29 | 11.1 | 53.9 |
| 30 | 25.4 | 39.6 | 30 | 6.0 | 59.0 |
| 31 | 34.9 | 30.1 | 31 | 10.4 | 54.6 |
| Total | – | 1244.6 | Total | – | 1527.5 |
How We Translate Weather into Heating Demand: Heating Degree Days (HDDs)
To quantify cold weather, we use Heating Degree Days (HDDs).
How HDDs work:
- Start with a base temperature of 65°F
- Subtract the average outdoor temperature for the day
- The result is the number of HDDs for that day
Example:
- Average outdoor temperature = 10°F
- HDD = 65 − 10 = 55 HDD
The colder the day, the higher the HDDs and the more heat your home requires.
What the Data Shows
When we apply this method to the daily temperature data:
- January 2026 produced roughly 290 more Heating Degree Days than January 2025
- That’s a large increase in heating demand for a single month
More HDD Means…
Longer system runtime
More energy consumed
Higher utility or fuel costs
This relationship applies to all heating systems, including geothermal.
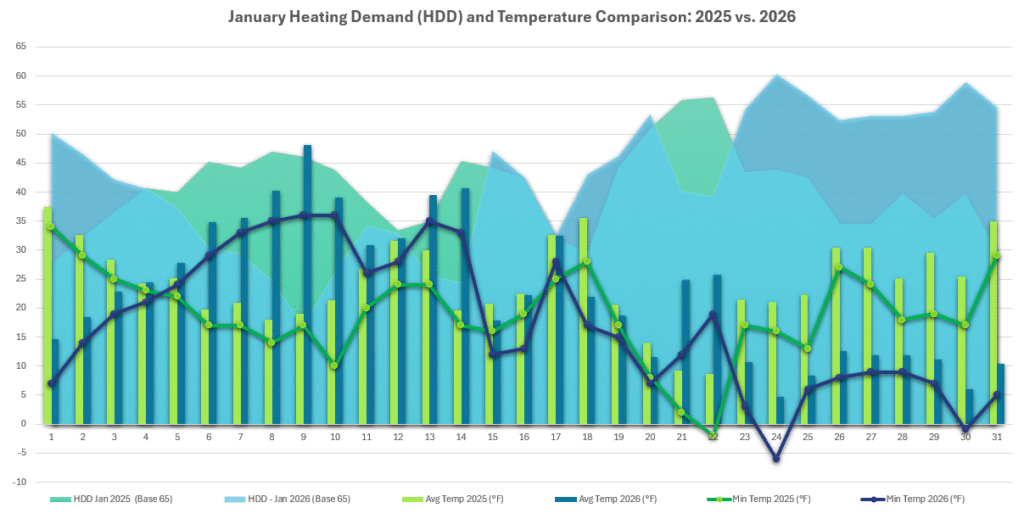
The graph above highlights the following data: HDD January 2025, HDD January 2026, Average Temperature 2025, Average Temperature 2026, Minimum Temperature 2025, Minimum Temperature 2026. This showcases that there is a relationship between HDD and average temperature, as well as minimum temperature. On days the we experienced negative temperatures, the HDD was highest!
Converting HDDs into Energy Usage
To make HDDs more tangible, we convert them into estimated energy use.
| Fuel Type | Efficiency | Fuel Price | kWh/HDD (thermal) | $/HDD |
|---|---|---|---|---|
| Geothermal HP | 4.59 COP | $0.21/kWh | 0.84 kWh | $0.18 |
| Heating Oil | 80% | $3.99/gal | 3.85 kWh | $0.47 |
| Propane | 80% | $3.40/gal | 3.85 kWh | $0.61 |
Additional energy due to January 2026 cold:
| Fuel Type | HDD Unit Cost ($/HDD) | Additional 300 HDD (January 2026) | Estimated Increase in Heating Cost ($) |
|---|---|---|---|
| Geothermal Heat Pump | $0.18 | 290 | $52.20 |
| Heating Oil (80% efficiency) | $0.47 | 290 | $136.30 |
| Propane (80% efficiency) | $0.61 | 290 | $176.90 |
That additional energy use is driven entirely by weather, not changes in thermostat settings or system performance.
Case Study: Increase in Energy Usage for a Rochester NY Home
The information below shows the increase in the home’s energy usage directly due to the weather. We show a side by side comparison to include the increased costs if the homeowner had a Fuel Oil or Propane heating system. This data comes directly from one of our Geothermal Heat Pump Customers.
| Home Size | 1980 sq ft | ||
| Heating Load | 35,590 BTU/h (~10.43 kW) | ||
| Additional HDD (Jan 2026 vs Jan 2025) | +300 | ||
| Energy per HDD | ~3.85 kWh/HDD | ~3.85 kWh thermal/HDD | ~3.85 kWh thermal/HDD |
| Weighted COP / Efficiency | 4.59 | 80% | 80% |
| Electricity / Fuel Used | ~243 kWh | ~0.179 gal/HDD × 290 ≈ 51 gal | ~0.119 gal/HDD × 290 ≈ 34.5 gal |
| Cost per Unit | $0.21 / kWh | $3.40 / gal | $3.99 / gal |
| Estimated Increase in Monthly Cost | $51 | $173 | $137 |
Why Even Efficient Systems Cost More in Extreme Cold
Geothermal heat pumps remain one of the most efficient heating options available especially during long winters like this one. However:
- Colder outdoor temperatures mean greater heat loss
- Longer cold spells mean longer runtimes
- Efficiency reduces energy per unit of heat, but it can’t eliminate the need for heat
In fact, geothermal systems often perform more steadily than conventional systems during prolonged cold, but they still respond to increased heating demand.
The Reassuring Part: This Is Weather-Driven and Temporary
The same analysis that explains higher bills also tells us something reassuring:
- As outdoor temperatures rise, Heating Degree Days fall
- Systems run less
- Monthly energy use drops naturally
January 2026 was unusually cold, even by Western New York standards. As we move toward milder weather, heating demand and costs will come back down.
If you ever have questions about your system or how weather impacts your energy use, we’re always happy to walk through the data with you.

COMMENTS